
Feb 3,
2016
We’re currently exploring some of the issues related to federal-provincial carbon coordination in a blog series, and the emissions gap is a key measure of the work at-hand. The first blog in the series outlined three primary objectives, and five of the largest inherent challenges. The logical next step is to think about the scale of the problems underlying these challenges. Conveniently enough, the Federal Government just released their latest greenhouse gas emissions projections, which estimate a significant gap between projected emissions and the 2030 target.
National coordination on climate change policy is quickly emerging as a key issue for 2016. Environment ministers met last week to discuss policies to reduce GHGs. And first ministers are set to meet by early March to discuss a framework for coordination. But what is the problem that federal and provincial governments are trying to solve? Three kinds of “gaps” define the issue for Canada.
The first of three gaps is the quantity of emissions reductions Canada needs to achieve. Canada’s current national target requires reducing GHG emissions to 30% below 2005 levels by 2030. To put that into context, Environment Canada projects that we are currently on track to hit around 815 Mt of emissions in 2030. Hitting the target would require Canadian emissions to be 524 Mt in 2030, or 291 Mt below where we would otherwise be in 2030. The emissions gap is the difference between 815 Mt and 524 Mt. The figure below illustrates these projections and the emissions gap. It also shows an uncertainty bound around projected emissions under current policies. It does not, however, show the impacts of accounting for land use and forestry emissions. Environment Canada notes analysis is ongoing, though this piece from University of Ottawa Professor Nicholas Rivers discusses how these emissions have significant implications on achieving the target.
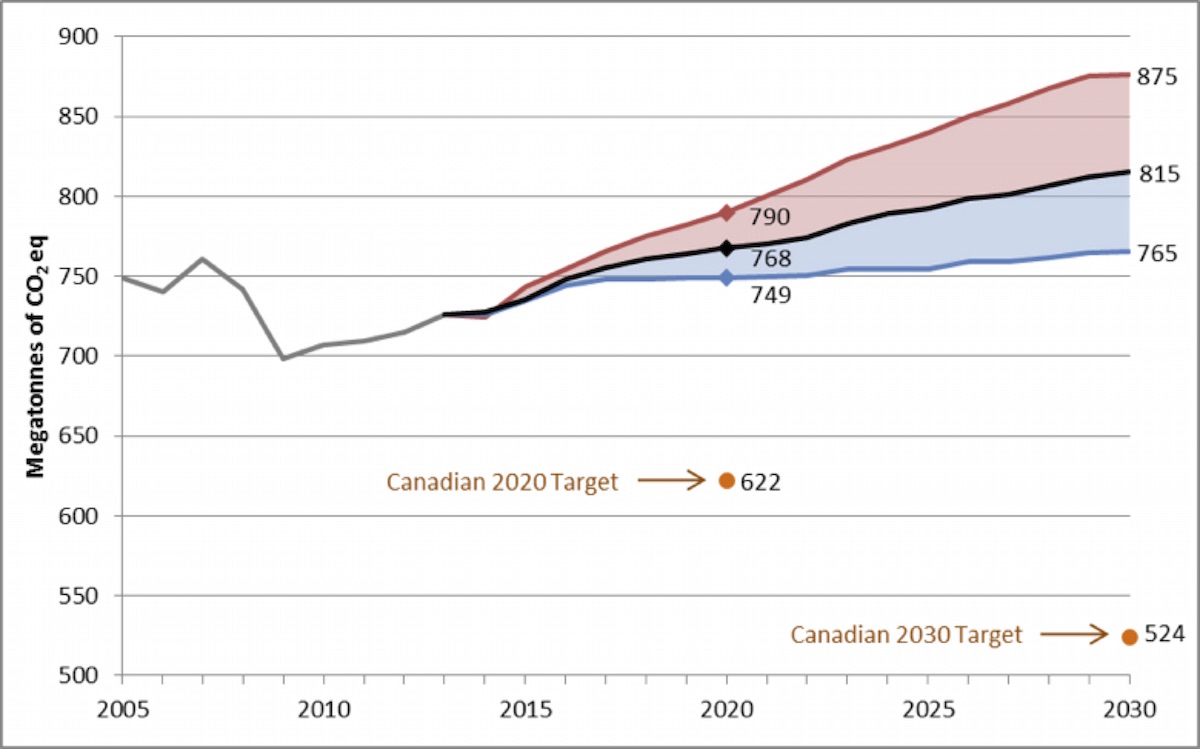
Source: Environment Canada, 2016
New climate and energy policy, of course, will influence future emissions scenarios. That means that the emissions gap in the figure is really a policy gap. It suggests that new policies are needed to bend down Canada’s emissions curve. Changing economic circumstances (such as the price of oil or rates of economic growth) aren’t enough to change Canada’s emissions trends on their own: even if emissions fall on the low end of these projections, Canada will be well short of its target.
The Ecofiscal Commission has argued that carbon pricing policies are the lowest cost way to close that policy gap. Unlike regulatory policies, carbon pricing policies provide emitters with the greatest flexibility to find low-cost emissions reductions. Still, as discussed in a recent piece by Simon Fraser University Professor Mark Jaccard, it’s possible to build some flexibility into regulations, and a combination of carbon pricing and smart regulations could form the basis of a comprehensive emissions reduction plan. Coordination among governments will help to determine what share of reductions should come from pricing.
But clearly, there already are carbon pricing and regulatory policies in Canadian provinces. The impact of those existing policies, however, is already baked into those emissions projections we discussed above (with the exception of Ontario’s pending cap-and-trade system and Alberta’s new-and-improved carbon fee). The issue therefore isn’t just that carbon must be priced. To drive emissions reductions most cost-effectively, it also needs a higher, pan-Canadian price , consistently applied broadly across Canadian GHG emissions.
What kind of pan-Canadian price would be required to achieve the targets? Most studies suggest the price would have to rise to a level significantly higher than any carbon price currently in place in Canada. For example, a 2011 report from the National Round Table on the Environment and the Economy suggested that meeting Canada’s previous target of 17% below 2005 levels by 2020 would have required a national carbon price of $74/tonne. And analysis by Jaccard’s research group found that achieving the current target of 30% below 2005 levels by 2030 would require a price that rises to $160/tonne by 2030 in the absence of new complementary policies.
Provincially, Alberta and British Columbia recently released reports that indicate the magnitude of the price needed to achieve significant provincial reductions. The Alberta report cites modeling showing that an economy-wide carbon price rising to $100/tonne by 2030 would still be too low to achieve the scale of emissions reductions set out in the Province’s 2008 Strategy (50 megatonnes below BAU by 2050). And modeling in the 2015 BC report shows the impacts of increasing the existing $30/tonne tax by $10/year beginning in 2018 (rising to $160 by 2030). Such a scenario would reduce the level of emissions forecast for 2030 by approximately 30%.
These findings offer an indication of the magnitude of a pan-Canadian carbon price required to close the emissions gap. Of course, each province’s and territory’s economy will respond differently to a given carbon price, given varying economic structures. But with Canada’s emissions currently on track to be 56% above the 2030 target, it’s clear that a pan-Canadian price would have to come into effect soon, and rise quickly to close the gap.
Check back in with us as we continue this series exploring issues related to coordination. Next week, we’ll discuss the range of benefits that come with increased policy coordination across provinces.
On February 23, we held a live panel discussion about #FedProvCarbon Coordination.
Watch the Panel
Send this to friend


2 comments
Great analysis, thanks.
Does your chart include competing energy technologies?
Thanks Graham for reading, and for your question.
The forecast and figure–which we note is from Environment and Climate Change Canada–is based on their modelling. These energy-economy models incorporate representations of current and improved/alternate technologies. Build in existing policy, and you get a BAU forecast which is shown in their chart. ECCC note that they include a range of assumptions about economic growth, and energy prices which is what the range of blue and red represents.
Best,
Adam
Comments are closed.